Background
Providing High-Quality, Integrated Data ...
The Traffic Data Section is responsible for collecting portable, temporary, short-term traffic counts at approximately 7,500 locations statewide on a three-year cycle. We also operate and maintain 81 permanent automatic traffic recorders (ATRs) and 16 weigh-in-motion (WIM) sites statewide. These permanent sites collect vehicular traffic and weight data continuously throughout the year.
The measurement of traffic volumes (including the type of vehicle, bikes, and pedestrians) is an essential, mission-critical function of highway planning, design, maintenance and management. Traffic volume counts are the most common measure of roadway use, and they are a required input to most traffic engineering and planning analyses. This information is used to develop infrastructure project design parameters that are supplied to engineers responsible for construction plans.
Our goal is to safely collect a snapshot of current traffic volumes and to provide timely design information to NDDOT engineers and other constituents, businesses, customers and partners.
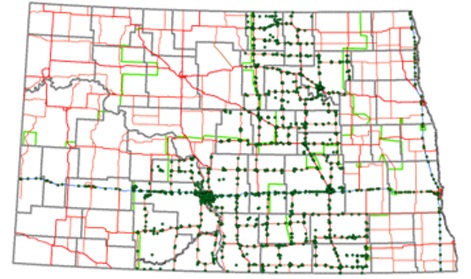
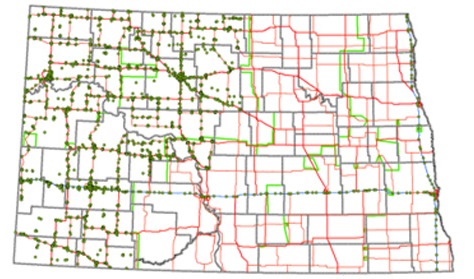
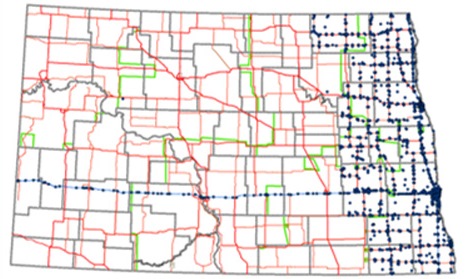
Maps
Traffic Data Collection
While several traffic volume statistics are used in traffic analyses, two are of primary interest for the design of statewide traffic-monitoring programs: annual average daily traffic (AADT) and average daily vehicle distance traveled (DVDT).
Because DVDT is computed by multiplying the roadway segment AADT by the length of that segment, the primary goal of a traffic-monitoring program is to develop accurate AADT estimates, which can be expanded to estimates of travel distance or mileage.
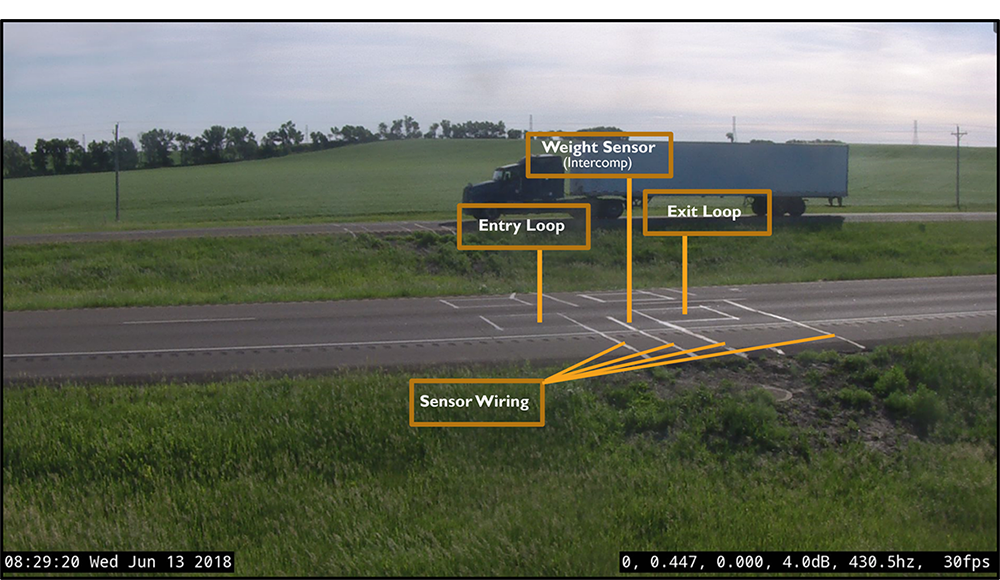
WIM Sites
The statewide network of weigh-in-motion (WIM) sites are used as screening devices to protect the state's highway infrastructure from overweight vehicles that can cause damage to roads and bridges.
These sites are comprised of in-pavement sensors that detect the presence of a vehicle, as well as the force applied to 'weight' sensors. These sensors don't actually weigh the vehicle; instead, they measure the force applied to the sensor by each vehicle axle and determine the weight through the use of algorithms. These WIM sites are calibrated each year with a calibration vehicle of known weight.
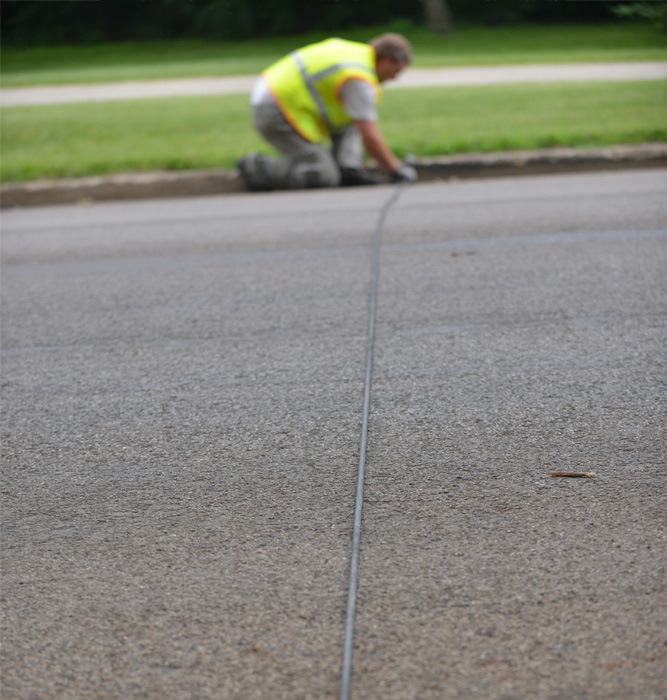
Portable Traffic Count Locations
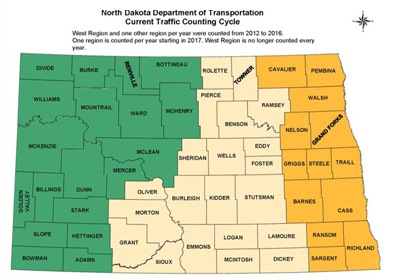
State traffic count data collection consists of a periodic comprehensive coverage program over the entire system on a three-year cycle.
Traditionally, NDDOT has counted vehicular traffic at 7,500 locations across the entire state, with one region and all Interstates counted each year. In 2012, NDDOT began counting two regions annually, with the west region counted every year, and the other two regions counted in alternate years. In 2017, after the most recent oil boom stabilized, NDDOT returned to counting one region each year.
The classification of a vehicle refers to the number of axles and the spacing between each axle, which determines whether the vehicle is a car or a semi-tractor trailer. These classifications are based on the Federal Highway Administration (FHWA) vehicle classification scheme. A volume vehicular count only counts the number of vehicles; it does not determine whether the vehicle is a car or semi-tractor trailer.
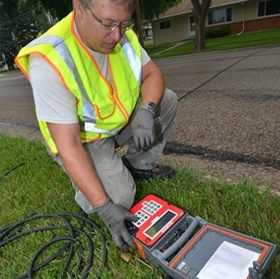
Seasonal adjustment factors are calculated from the network of NDDOT automatic traffic recorder (ATR) sites. These sites count vehicular traffic 24x7x365, which allows a daily and monthly adjustment factor to be developed. This adjustment factor is then applied to NDDOT short-term or portable vehicular traffic counts to determine an annual average daily traffic (AADT).
Traffic Count Web Access
You can access historical traffic counts on the NDDOT's Transportation Information Map.
Map Key
- A blue circle indicates a volume-only count (no vehicle classification).
- A red square denotes a vehicle classification count. Each vehicle is classified in one of the 13 Federal Highway Administration (FHWA) standard classifications.
- A green square represents a vehicle classification count that was captured with video technology. The video is processed by the vendor using the video pixels and classifies vehicles into one of six types using the 13 FHWA classes, with slightly different groupings.
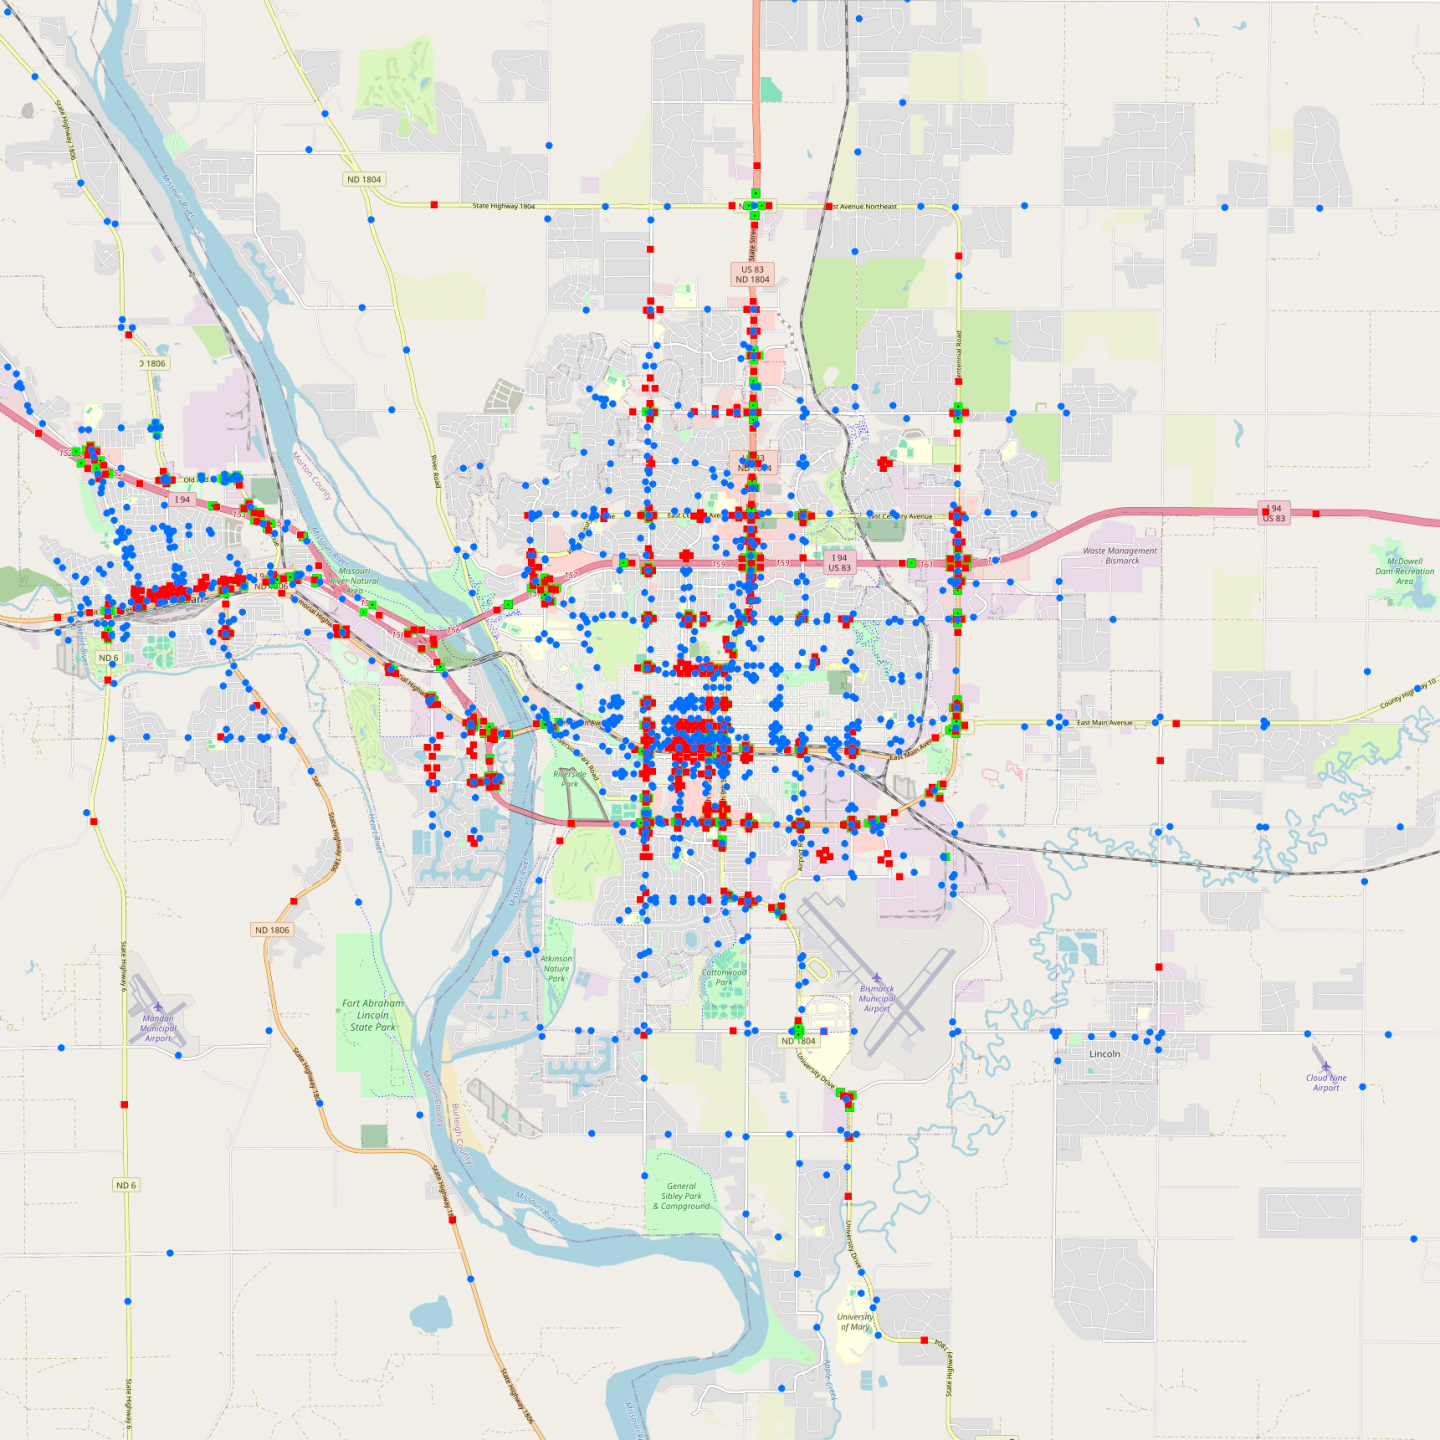
City of Bismarck GIS Traffic Count Map (Example)