Learn about the purpose of this program and how it works with different facets of the state, the types of data it collects, and how the data used strategically by departments.
Pavement Management Program Background
The Pavement Management section has two main parts: pavement management and pavement condition data collection.
Pavement management uses dTIMS, a software tool that acts as a manager and integrator of asset information, to enable the department to make more objective and consistent decisions by providing quality information to all decision levels. Pavement management also helps communicate the Department’s fiscal needs for improving and maintaining the highway network.
Pavement condition data collection is responsible for collecting, analyzing, and distributing state highway pavement condition and profile data needed to provide districts, divisions and executive management with strategic highway system recommendations. This section is also responsible to serve its internal and external customers by providing valuable data and analysis on pavement condition.

Pavement Management System
dTIMS (Deighton Total Infrastructure Management System) is the DOT’s Asset Management Software which is primarily used for pavement analysis and project recommendations. It’s also used for Personal Freight and Mobility recommendations focusing on bottlenecks.
Expand the bar to read detailed information about the background of the Pavement Management System.
PMS Background
Using dTIMS, NDDOT makes data driven decisions to preserve the pavement condition and reduce freight bottlenecks. The software tool acts as a manager, integrator, and analyzer of asset information enabling the department to make more objective and consistent decisions by providing quality information and forecasts to all decision levels.
In its simplest form, dTIMS comprises a ‘database’ component and an ‘analysis’ component. The ‘database’ component allows the department to input infrastructure data and analysis parameter data. The ‘analysis’ component determines the best preservation and improvement actions for each pavement segment based on the budgetary and technical constraints. This enables the department to create outputs such as forecasted long term impacts and a recommended construction program optimized to preserve the existing pavements and make the most progress toward system performance goals.
Currently, there are two investment classes within dTIMS: Pavement Preservation and Freight and Personal Mobility (also referred to as Functional Capacity). Each investment class:
- is set up individually within dTIMS BA and is analyzed separately of each other
- is assigned its own budget(s) when the analyses are run
- has its own set of triggers, resets, deterioration rates, and treatments that are used for project recommendation
Pavement preservation focuses on pavement condition and keeping the overall network in as good a physical condition as possible with the treatments that are recommended from the analysis. The pavement preservation analysis focuses strongly on picking preservation treatments to keep the network in good condition rather than waiting and letting the network segments deteriorate to a condition of needing a much higher cost treatment like reconstruction. Freight and Personal Mobility focuses on what the system is intended to do by monitoring the operational restrictions of the roadway and removing as many of them as possible with the treatments that are recommended. Therefore, this investment class improves the services delivered by the transportation system.
- Click here to see a full description of dTIMS BA


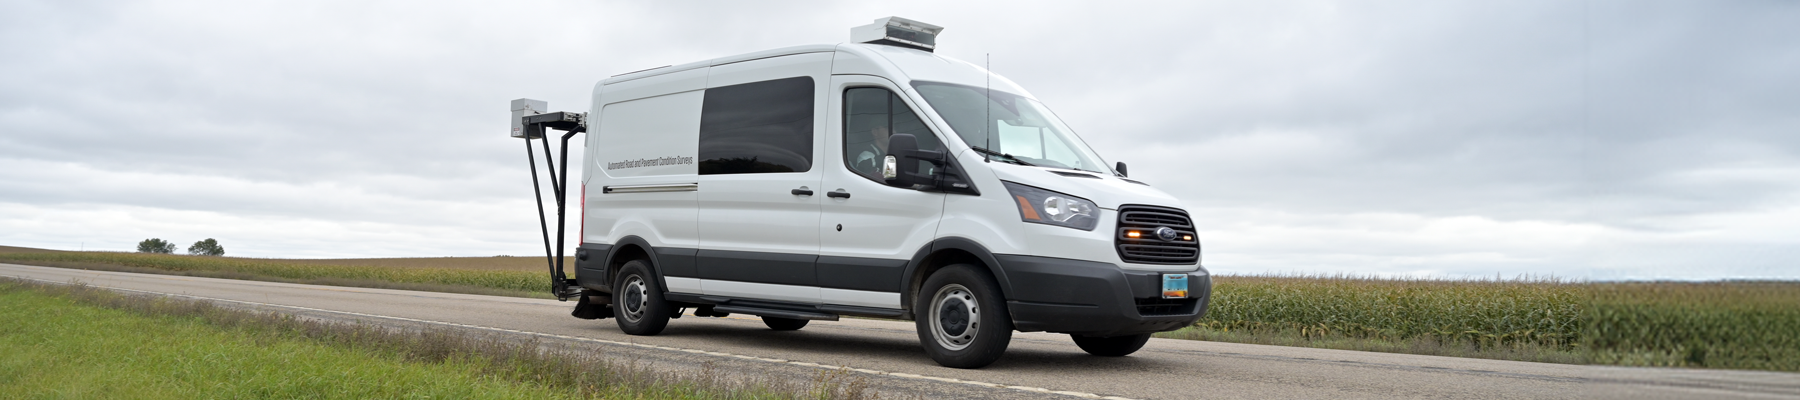
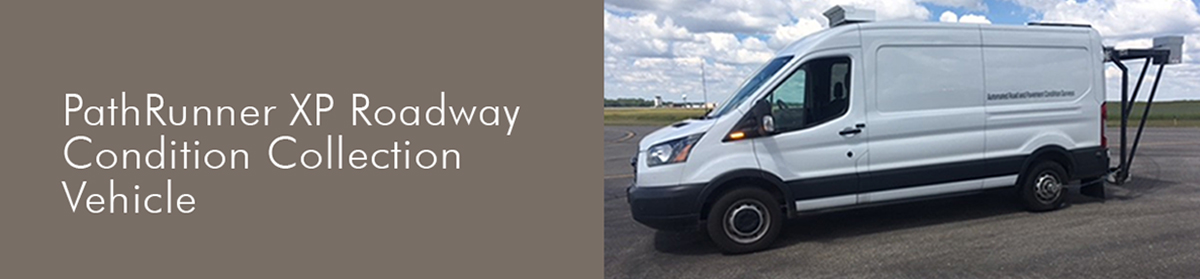
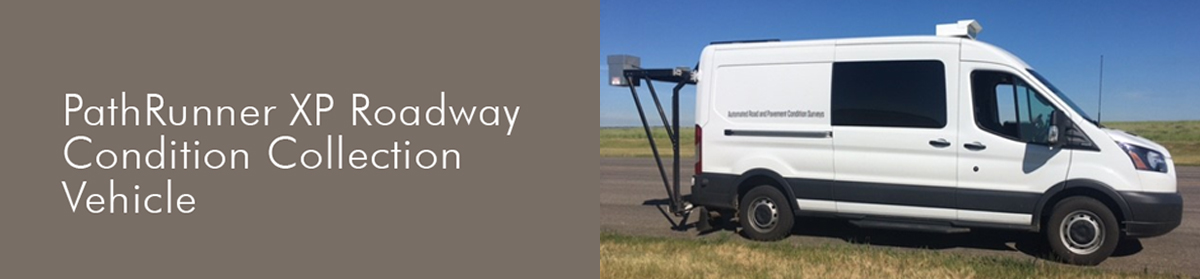
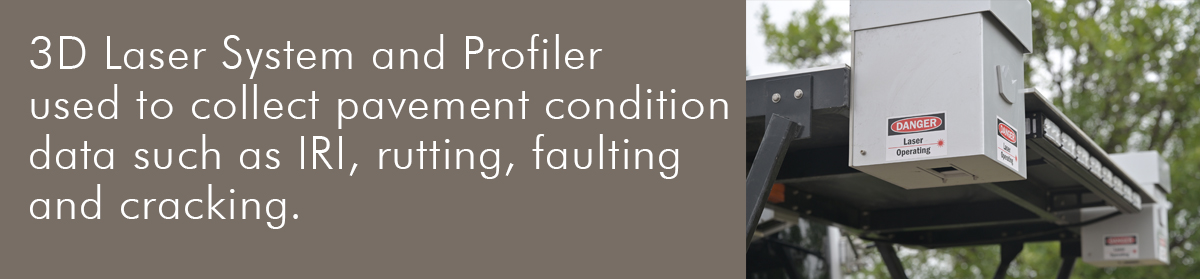
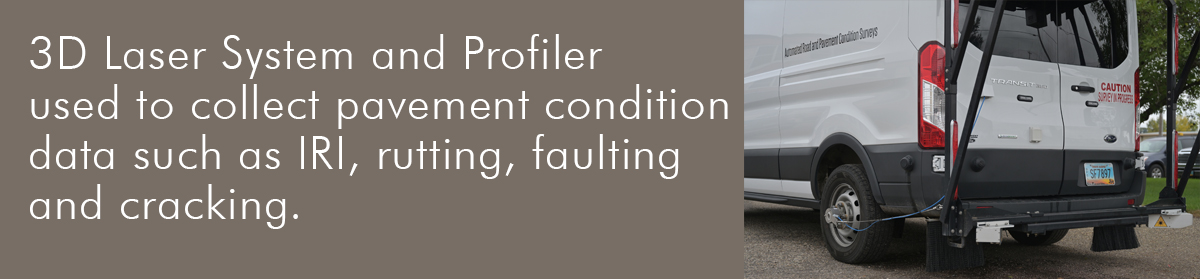
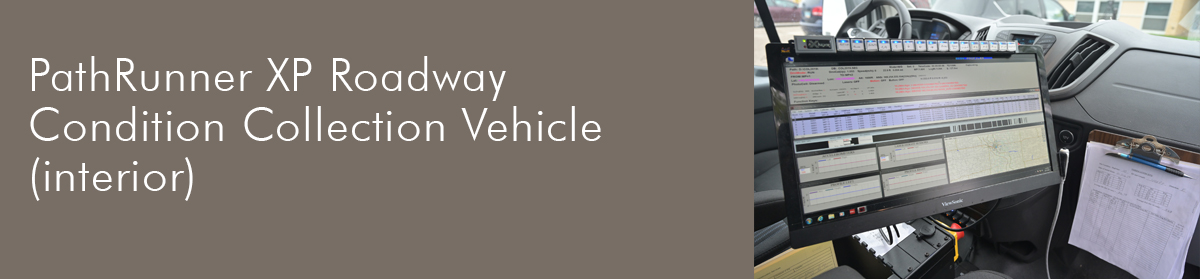
Pavement Condition Data Collection
Approximately 8600 miles are collected, using the van shown above, annually starting in late summer. All 4-lanes are collected both directions every year and the 2-lanes alternate directions each year. The van is also used to collect special requests such as possible flood detour routes and research projects.
All roadway data is collected and processed in accordance with NDDOT’s Data Quality Management Plan.
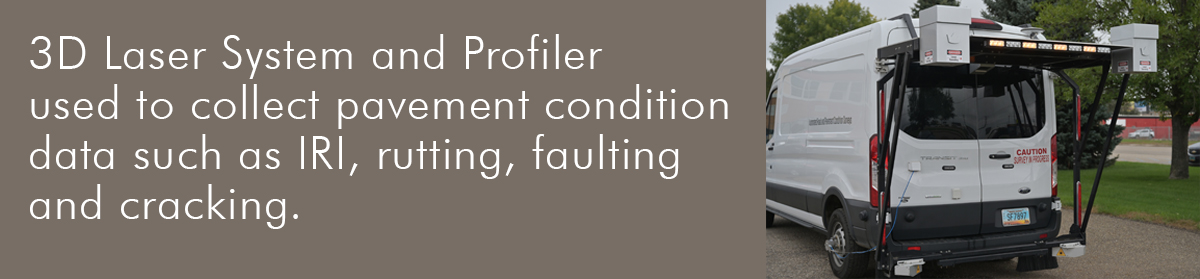
Some of the data collected is:
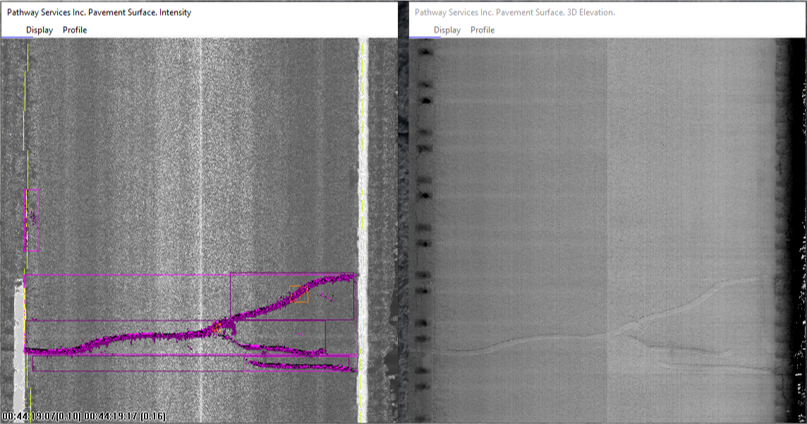
- Ride | Measurement of road smoothness using the International Roughness Index (IRI)
- Rutting | A depression or groove worn into a road by the travel of wheels
- Faulting | The difference in elevation across a transverse joint or crack
- Cracking | Refers to a variety of pavement distresses that occur on the surface of different types of pavements
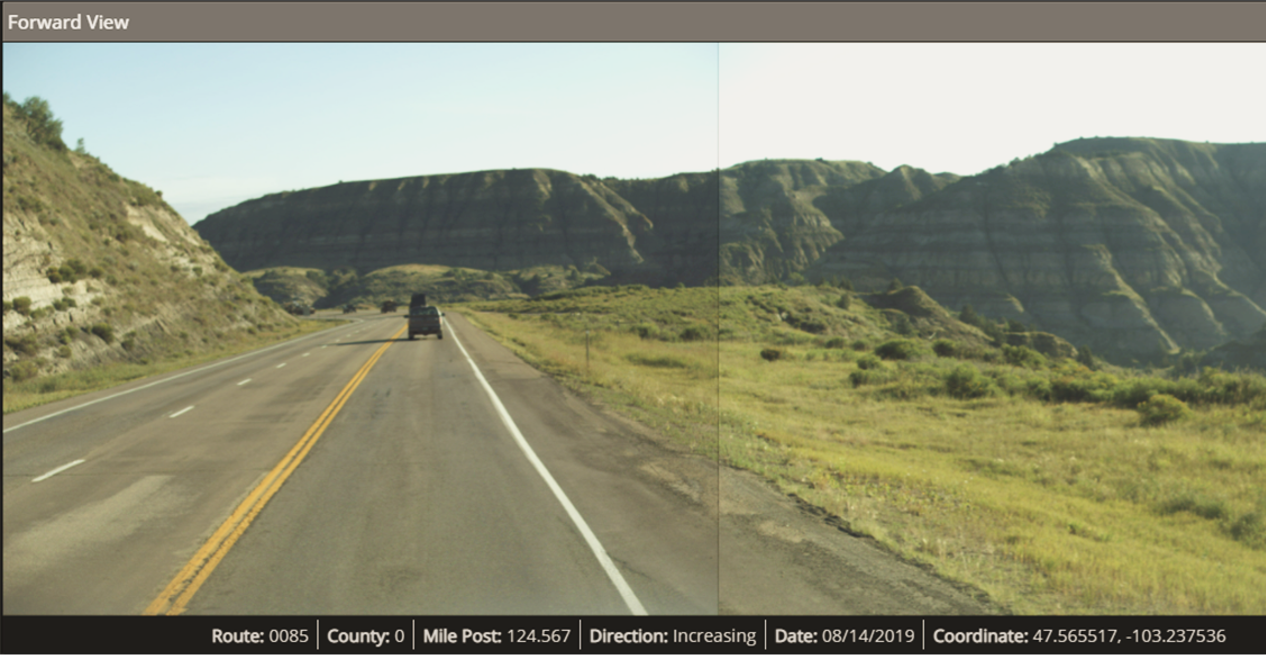
The data collection vehicle has a forward-facing and right perspective camera. The images taken by those cameras are downloaded and used by NDDOT engineers.
Expand the bars below to view the images.
Recommendations and Results
dTIMS makes project recommendations based off of different budgets, triggers, resets, and deterioration rates. It also runs a 20-year analysis that not only recommends projects over those 20 years but also tracks deterioration of data elements such as IRI (Ride). The deterioration of IRI over the 20-year analysis period can then be graphed and used by management to tell the story of what will happen to the DOT’s network of roadways if additional funding isn’t available.
The 20-year recommendations are also given to the Districts to be used as a tool when setting their priorities each year.
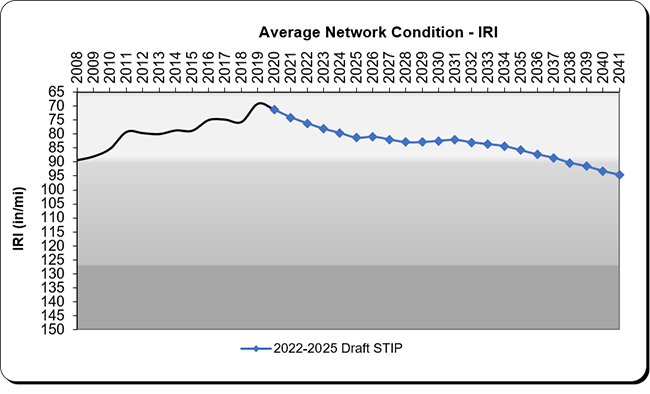
The dTIMS recommendations are presented to Management during the STIP (Statewide Transportation Improvement Program) briefings. During those briefings, the analysis is also compared to the projects in the STIP to see what percentage of projects match.
Using the Freight and Personal Mobility analysis, dTIMS is used to produce NDDOT’s Freight Constraints Map annually. The Freight Constraints Map can be found under “ND State Freight Plan Resources” on the NDDOT webpage or by using this link: NDFreightConstraintsMap.pdf
Pavement Management System Triggers
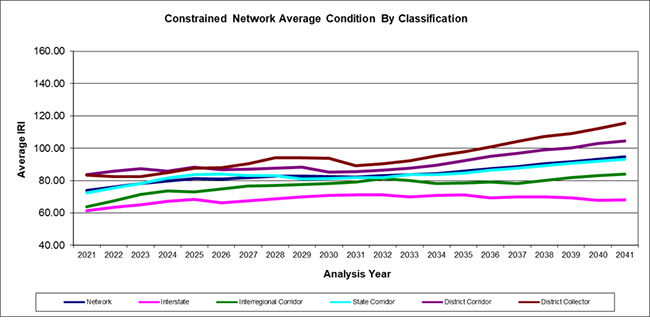
During the network analysis, dTIMS uses triggers to determine when to apply a treatment on a roadway segment. Triggers are analysis variables within dTIMS (example: IRI, rut, AADT, TAADT, roadway width, etc.). The triggers make up the decision trees. Once a trigger reaches a certain value, it is used to determine the treatment.
Each highway classification (Interstate, Interregional, State Corridor, District Corridor, and District Collector) has its own separate decision tree based off pavement type.